Home
Tutorial's
Image collection
Calculator
Projects
MCQ's
3d Models
Invention Hub
How it works
Download Our app
Module 10: Effect of Temperature on Resistance
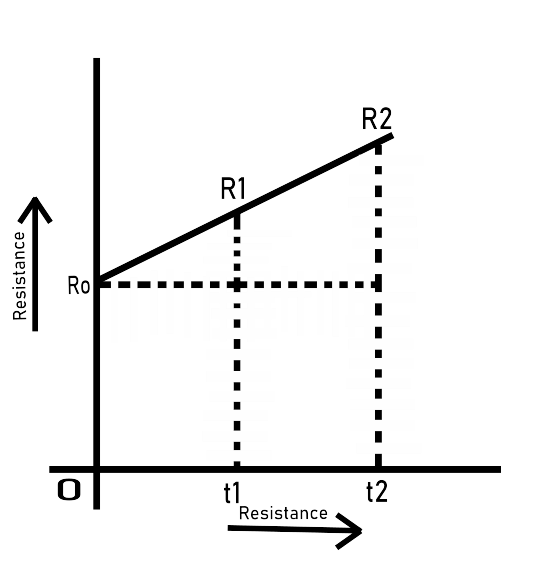
In a normal range of temperatures, the resistance of a metallic conductor increases linearly with the rise in temperature. Therefore, the resistance-temperature graph is a straight line as shown in Fig.

In the above image, R0 starts from a certain resistance value because every material has some resistance, and as temperature increases, the resistance increases, respectively.
Consider a metallic conductor having resistance Roat 0oC and R1 at t1 oC . In the normal range of temperatures, the increases in resistance are (i.e., R1 – R0).
(i) Directly proportional to the initial resistance i.e.,
R1-R0 ∝ R0
(ii) Directly proportional to the rise in temperature i.e.,
R1-R0 ∝ t1
By combining the two equations above, we get.
R1-R0 ∝ R0t1 ----------(1)
Where α0 is a constant and is called temperature co-efficient of resistance at 0 degree celcius and the value depend on the nature of material and temperature
From above eq (1) we can write as R1=R0(1+ α0t1) -------(2)
And ,α0 = (R1-R0)/(R0 x t1)
Temperature coefficient α1 at t10c is given by
α0R0= α1R1
α 1= α0R0/ R1
α1= α0R0/R0(1+ α0t1) ------------- from eq(2)
α1 = α0/(1+α0t1)
similarly for α2 =
Related articles
